Latest Posts

Elmwood Cycle Traps Fixed

Cycle Trap Fixed :: Penn DOT workers repair dangerous drain grates

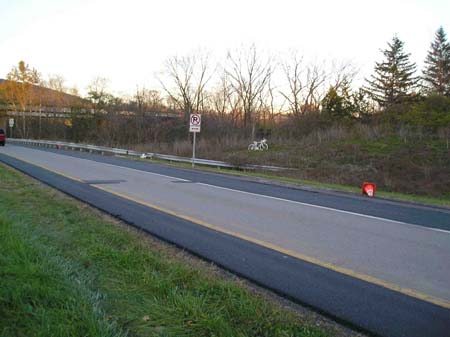
In response to CRBC’s request of last September, Penn DOT has repaired the dangerous drain grates on Elmwood Avenue in Lemont (see article below). The photo above left shows one of the grates before the repair. The photo at right, taken yesterday, shows the same grate after the repair. CRBC wishes to thank Penn DOT, College Township, and the Centre Region Planning office for their help in correcting these cycle traps.

Cycle Trap Fixed :: New and improved drain gate as installed

The Road to Health and Equality

To date, efforts to study the health effects of inequality in transportation have focused on crash injuries, noise-related stress and social disruption, pollution exposure, social isolation in high traffic neighborhoods, and difficulty accessing medical care by those who are transport disadvantaged. A 1999 World Health Organization study of mobility concluded “Exercise levels, social contact, and access to services in children, the elderly, the ill, and the poor is inversely related to the societal level of motor vehicle usage in all countries.” In 2006, Transportation Alternatives (TA) in New York published a study showing that people who live on streets with heavy traffic go outdoors less often and have fewer friends than those living on quieter streets. The study, “Traffic’s Human Toll” reveals that high volume vehicular traffic has profoundly negative impacts on the lives and perceptions of residents who live near it. The study concluded that, “Compared to their neighborhood counterparts living on streets with low traffic volumes, residents living on higher volume streets:
• harbor more negative perceptions of their block;
• possess fewer relationships with their neighbors;
• are more frequently interrupted during sleep, meals, and conversations;
• spend less time walking, shopping and playing with their children.” A 1995 study of social contact in San Francisco third graders showed that, on average, those living on streets with light traffic had three times as many friends and twice as many acquaintances as those living on streets with heavy traffic. Studies from the United Kingdom show that low socioeconomic status children are five times more likely to be killed in car-pedestrian crashes than are age-matched higher status children.

Nature Deficit Disorder describes a failure to develop a sense of connectedness with nature resulting from lack of meaningful experience of natural areas. This disorder develops in children who are constantly indoors or in motor vehicles. Children who are deprived of contact with nature begin to show deficits in motor and social skills as early as age five. The disorder was clearly demonstrated in a study by Marco Huttenmoser of Zurich in which children aged 6 and 7 were asked to draw pictures of their daily trips to school. The pictures drawn by those who walked to school were rich with color and showed details of plants, animals, and neighbors, while pictures drawn by classmates always driven to school showed inferior motor and drawing skill and tended to be devoid of living things, showing only the car, the road, and the origin and destination buildings.

Although some studies have mentioned feelings of insecurity related to traffic volume and proximity, analyses of the adverse health effects of the status syndrome resulting from transportation inequality have been lacking. The status syndrome describes a direct link between social status and health, independent of other health risk factors. Higher social status is associated with lower risk of illness across a broad spectrum of health and disease indicators. The syndrome was first described by Sir Michael Marmot, professor of Epidemiology at the International Institute for Society and Health, University College , London . According to Marmot, “The higher the social position, the longer can people expect to live, and the less disease can they expect to suffer.”

Marmot first noticed the effect during analysis of data from the 1970’s Whitehall Study which looked at coronary artery disease risk factors among British civil servants housed at Whitehall , U.K. Whitehall was studied because its high degree of stratified organization lent itself to ready collection of the data needed. When the data were analyzed, Marmot was surprised to discover that position in the bureaucratic hierarchy was directly related to the risk of coronary events. Thus, the number one official at Whitehall was less likely to have a myocardial infarction (M.I.) in any given period of time than was the number two official who was at less risk than the number three official. This effect continued undisturbed down the hierarchy and was independent of all other risk factors. Men in the lowest employment grade (office support) were four times more likely to experience M.I. than those in the highest grade (administrative). In fact, the data showed employment grade to be a more powerful predictor of M.I. than the classic risk factors of smoking, serum cholesterol, and blood pressure combined. This astounding finding led to a second (Whitehall II) study of 17,000 bureaucrats which confirmed and expanded upon the original findings.

Several studies have since confirmed the reproducible risk difference associated with even small salary differences. These studies have refuted the argument that the health risk disparity between different socioeconomic classes are solely the result of lifestyle differences or differing ability to afford health care, although those factors are real and operate independently of the status syndrome

Work stress and work hierarchy have been shown to be independent risk factors for the metabolic syndrome (a constellation of coronary risk factors, including central adiposity, hypertension, glucose intolerance, and hyperlipidemia). The more work stress that was reported, the greater the likelihood of having the metabolic syndrome. Ninety percent of the metabolic syndrome stratification by employment grade remained after smoking, sedentary lifestyle, and alcohol consumption were factored out. In addition, several studies have shown a direct link between increased risk of coronary disease and low control in the workplace and perceived imbalance between efforts and rewards. This lack of control is much more stressful and harmful to health than is the perceived heavy workload and long work hours typically associated with upper level administrative positions. The impact of the status syndrome seems to be more severe the greater is the degree of inequality in any given hierarchy. This is seen in the health status rankings of nations. Thus, the large disparity between social classes in the U.S. is thought to be a major reason this wealthy country, which spends the most per capita on health care, consistently ranks far down the list in such parameters as infant mortality and life expectancy.

The status syndrome is demonstrable over a wide range of health variables including longevity, infant mortality, HIV/AIDS, and others. It is also demonstrable across a broad array of socioeconomic variables such as employment hierarchy, community social status, regional and national economic ranking, and even education level. A 1990’s study in Sweden showed M.I. risk to be lower the higher level of educational degree obtained even to a difference depending on the number of PhD’s an individual has earned

The status syndrome is thought to be mediated through the mechanisms by which our endocrine and nervous systems respond to stress. Acute stress causes an outpouring of hormonal and nervous system impulses to enable the organism to cope more effectively (the “fight or flight” response). Chronic stress produces constant elevations of these levels which negatively affects the health of the organism. Numerous studies have demonstrated that individuals’ stress hormone (glucocorticoids and catecholemines) levels are inversely related to social status in humans and all other primate species with social hierarchies. In human societies, stress associated with the adverse effects of status is compounded by internalization of messages of inferiority resulting in poor self-esteem. Insecurity, chronic anxiety, social isolation, and lack of control in work and social interactions undermine mental and physical health.

The effects of the status syndrome seem to begin well before birth. Maternal stress hormones and other chemical factors cross the placenta. Low birth weight and predisposition to a number of metabolic diseases are directly associated with lower social status. Blood cortisol levels in adults are inversely related to birth weight. Low birth weight is a direct risk factor for later development of diabetes type 2. Multiple studies have shown that mortality is related directly to low levels of social integration. The status syndrome even has linear geographic correlates. The life expectancy of a male resident of Washington D.C is 57 years and increases 1.5 years per mile to Montgomery County , Maryland , where the male life expectancy is 76.7 years. Following the collapse of the Soviet Union in 1990, the associated decline in social status and the rise of social inequality led to a rise in mortality which was somewhat mitigated by higher education level. In 1978, coronary disease mortality rates were nearly identical in Lithuania and Sweden . By 1994, coronary mortality was four times higher in Lithuania than in Sweden .

The World Health Organization’s landmark 2005 report on the social determinants of health, “The Solid Facts,” recognized transport as a major area where inequality negatively affects health. But even that report, co-edited by Sir Marmot, failed to consider the status syndrome as a direct health risk factor in its transportation section. We need to recognize that, as was true within Whitehall , our transportation systems are designed as hierarchies with motorists enjoying higher status than other users. Usually, the degree of disparity between motorists and others is extreme. Typically, pedestrians are at the bottom of this social stratification. As we spend longer hours using these systems, especially in areas where sprawl development is the norm, the adverse health effects of this designed inequality can be expected to reach greater prominence. Unfortunately, this effect has received little study.

Let us now consider some situations in which transportation disparity has been reduced. In 1991, Cuba was suddenly faced with a transportation crisis when the collapse of the Soviet Union interrupted its oil supply and immobilized its motor vehicle fleet. The government declared a “special period” emergency. All available means of alternative transportation were put into use. 1.5 million bicycles were imported from China , and tractor trailers were converted to “camel” buses which can carry up to 150 passengers. The crisis served to decrease transportation disparity. In general, social inequality is much less extreme in Cuba than in most developed countries. The Cuban population now consistently ranks much higher than the U.S. in measures of health.

Enrique Penalosa became mayor of Bogota , Colombia in 1995. He implemented a plan of social equalization which concentrated on promoting transportation equality. During his six years in office, Penalosa’s administration developed 52 new schools, refurbished 150 others, added 14,000 computers to the public school system, and increased student enrollment by 34 percent. He also built three large central libraries and 10 neighborhood libraries. He improved life in the slums by bringing water to 100 percent of Bogotá households, and buying undeveloped land on the outskirts of the city to prevent real estate speculation and ensure that it will be developed as affordable housing with electrical, sewage, and telephone service as well as space reserved for parks, schools, and greenways. Penalosa successfully reclaimed the sidewalks from motorists, who traditionally drove and parked on them with impunity. The year before he took office, over 200 pedestrians were killed by cars driving on the sidewalks or when they stepped into the street to go around cars parked on the sidewalks. “I was almost impeached by the car-owning upper classes,” Peñalosa said, “but it was popular with everyone else.”

Penalosa estabished over 300 kilometers of separated bikeways, announcing, “These bike paths are a declaration that a citizen riding a $30 bicycle is equally as important as a citizen driving a $30,000 car. We built symbols of respect, equality and human dignity, not just sidewalks and bike paths. Motor vehicles on sidewalks were a symbol of inequality – people with cars taking over public space. A premise of the new city is that we want a society to be as egalitarian as possible. For this purpose, quality-of-life distribution is more important than income distribution, and quality of life includes a living environment as free of motor vehicles as possible.”

Penalosa created the Trans-Milenio, a bus rapid transit system (BRT), which now carries a half-million passengers daily on special bus lanes that offer most of the advantages of a metro at a fraction of the cost. His programs reduced traffic by 40 percent with a system where motorists must leave cars at home during rush hour two days a week. He also raised parking fees and gas taxes, with half of the proceeds going to fund the new bus transit system. He implemented an annual carfree day during which everyone had to use alternative transportation. He created a 45 km. greenway along a blighted river in a space which had been slated for an 8-lane highway. He built the world’s longest (17 km.) pedestrian street. He established or refurbished 1200 parks and playgrounds throughout the city.

Penalosa recently declared, “The world’s environmental sustainability and quality of life depends to a large extent on what is done during the next few years in the Third World ‘s 22 mega-cities. There is still time to think different… there could be cities with as much public space for children as for cars, with a backbone of pedestrian streets, sidewalks and parks, supported by public transport.” During his term in office, the murder rate in Bogota fell by two thirds. Violent crime rates declined dramatically, and quality of life indices rose. Penalosa’s successor has continued his programs which have been so popular that election of a mayoral candidate who espouses reversal of the equalizing efforts is considered exceedingly unlikely.

There are many other examples of legislative, infrastructural and programmatic changes which help to equalize transport modal status. Notable among them are the “green wave” traffic light system developed in Odense , Denmark , a city of 60,000 which has been designated the Danish National Cycling Laboratory. The green wave consists of roadside bollards which monitor cyclist speed. Each successive bollard flashes green when the cyclist approaching it is traveling at the speed for which traffic lights are timed. Riding with the “green wave” allows the cyclist to travel through the town without ever stopping for a red light. Motorists have begun traveling at the green wave speed to take advantage of this freedom from red lights. Also notable is the Netherlands law assigning fault to motorists in collisions with cyclists unless the cyclist can be proven to have deliberately caused the accident. The danger motor vehicles pose to other road users and the ease with which motorists can physically intimidate and dominate cyclists and pedestrians clearly justify further changes to promote parity.

Just as the city of Odense has become the Danish National Cycling Laboratory, the transportation changes of the “special period” in Cuba and those initiated by Enrique Penalosa in Bogota can provide laboratories for studying the benefits of transport equalization. To facilitate such study, methods to measure status syndrome effects in transport systems must be developed and refined.

In the USA in 2005, Hurricane Katrina highlighted the devastating result of decades of transportation policy which discriminates against those who do not own cars by dismantling public transportation systems while heavily subsidizing use of the private motor car. By the time the evacuation order for Hurricane Katrina was issued, the bus and train services out of New Orleans had already been shut down. Over 1/3 of New Orleans residents do not own cars. The last Amtrak train to leave New Orleans traveled to Tennessee not to evacuate people in the path of Katrina, but to avoid hurricane damage to Amtrak rolling stock. That train traveled to Tennessee empty of passengers.

Although more study is needed regarding the magnitude of the status syndrome effect in transportation systems, analysis to date supports the role this phenomenon plays in damaging the health of victims of transportation inequality. It is well proven that individuals seek to avoid the psychological and physical stress associated with low status. Our transportation systems are hierarchical by design and through properties intrinsic to each of the various modes. Without stringent effort to minimize status disparity between system users, those users will naturally tend to seek the perceived highest status level, the private motor car.

Through the status syndrome, motorists adversely affect the health of other modal users. This effect constitutes an externalization to society of the cost of motoring which has not been fully recognized or subjected to economic analysis. The costs of motoring not fully paid by motorists themselves have, therefore, been underestimated by economists. This externalization of cost must be accounted for in future economic analyses of transportation impacts

The perception of transportation mode status by individuals has largely become internalized and automatic. Transportation programs which elevate the status of pedestrians, bicyclists and transit users to equality or superiority with respect to motorists will help change this perception and should result in more rapid adoption of alternative transportation modes than programs which ignore status effects or which seek to change status perception by education or marketing approaches not accompanied by real and demonstrative changes in the system hierarchy. By lowering motor vehicle usage, these programs will serve to decrease the health impacts of both the status syndrome and the other adverse effects of transportation inequality mentioned above (i.e. crash injury, noise stress, social isolation, pollution exposure and healthcare access limitation).

Transportation equality is clearly a vital matter of health and social justice. I offer these recommendations as beginning steps:
•  Make equality promotion a goal of all transportation systems and a design feature of every transportation project.
•  Include equality analysis as a criterion in all transportation studies.
•  Develop transportation equality metrics to standardize these studies.
•  Consider the status syndrome in all studies of transportation health effects.
•  Recognize status syndrome health impact as an externalized cost in economic analyses of transportation projects

Paul K. Simpson, M.D. is a primary care physician of Internal Medicine. He practices at:
Clinton Medical Associates
7133 Nittany Valley Dr .
Mill Hall , PA. 17751

For reprints contact:
pksimp@comcast.net
570-726-7992 (office)
814-574-6334 (cell)
814-867-4266 (home)

Bibliography:

1. Phillips, D. I. W., Jones, A. (2006). Fetal programming of autonomic and HPA function: do people who were small babies have enhanced stress responses?. Journal of Physiology. 572: 45-50
2 . Marmot M. The Status Syndrome. New York , NY : Henry Holt; 2004.
3 . Marmot MG, Rose G, Shipley M, Hamilton PJS. Employment grade and coronary heart disease in British civil servants. Journal of Epidemiology and Community Health. 1978;32:244-249.
4. Adler N, Ostrove J. Socioeconomic status and health: what we know and what we don’t. In: Adler N, Marmot M, McEwen B, Stewart J, eds. Socioeconomic Status and Health in Industrial Nations. New York , NY : New York Academy of Sciences; 1999:3-15.
5. Mackenbach JP, Bos V, Andersen O, et al. Widening socioeconomic inequalities in mortality in six Western European countries. International Journal of Epidemiology. 2003;32:830-837.
6. McDonough P, Duncan GJ, Williams D, House JS. Income dynamics and adult mortality in the United States , 1972 through 1989. American Journal of Public Health. 1997;87:1476-1483.
7. Murray CJL, Michaud CM, McKenna MT , Marks JS. US Patterns of Mortality by County and Race: 1965-94. Cambridge , Mass: Harvard Center for Population and Development Studies; 1998:1-97.
8 . Williams DR. Racial variations in adult health status: patterns, paradoxes, and prospects. In: Smelser NJ , Wilson WJ, Mitchell F, eds. America Becoming: Racial Trends and Their Consequences, Vol II. Washington , DC : National Academy Press; 2001:371-410.
9. Britton A, Shipley M, Marmot M, Hemingway H. Does access to cardiac investigation and treatment contribute to social and ethnic differences in coronary heart disease? Whitehall II prospective cohort study. British Medical Journal. 2004;329:318.
10. Farmer P. Infections and Inequalities. Berkeley : University of California Press; 1999.
11. van Rossum CTM, Shipley MJ, Van de Mheen H, Grobbee DE , Marmot MG. Employment grade differences in cause specific mortality: a 25 year follow up of civil servants from the first Whitehall study. Journal of Epidemiology and Community Health. 2000;54:178-184.
12. Sapolsky RM. The influence of social hierarchy on primate health. Science. 2005;308:648-652.
13. Sen A. Inequality Reexamined. Oxford , England : Oxford University Press; 1992.
14. Kuper H, Marmot M, Hemingway H. Systematic review of prospective cohort studies of psychosocial factors in the etiology and prognosis of coronary heart disease. Seminars in Vascular Medicine. 2002;2:267-314.
15. Erikson R. Why do graduates live longer? In: Jonsson JO, Mills C, eds. Cradle to Grave: Life-Course Change in Modern Sweden . Durham , England : Sociology Press; 2001.
16. Kuper H, Marmot M. Job strain, job demands, decision latitude, and the risk of coronary heart disease within the Whitehall II study. J Epidemiol Community Health 2003; 57: 147-53
17. Berkman LF, Glass T. Social integration, social networks, social support, and health. In: Berkman LF, Kawachi I, eds. Social Epidemiology. New York , NY : Oxford University Press; 2000:137-173.
18. Kuper H, Singh-Manoux A, Siegrist J, Marmot M. When reciprocity fails: effort-reward imbalance in relation to coronary heart disease and health functioning within the Whitehall II Study. Occupational and Environmental Medicine. 2002;59:777-784.
19. Hemingway H, Shipley M, Brunner E, Britton A, Malik M, Marmot MG. Does autonomic function link social position to coronary risk? the Whitehall II Study. Circulation. 2005;111:3071-3077.
20. Brunner EJ, Hemingway H, Walker BR, et al. Adrenocortical, autonomic, and inflammatory causes of the metabolic syndrome. Circulation. 2002;106:2659-2665.
21. Shishehbor MH, Litaker D, Lauer CE. Association of socioeconomic status with functional capacity, heart rate recovery, and all-cause mortality Journal of the American Medical Association. 2006;295:784-792.
22. Chandola T, Brunner E, Marmot M. Chronic stress at work and the metabolic syndrome: prospective study. BMJ. 2006 Mar 4;332(7540):521-525. Epub 2006 Jan 20.
23. Willms JD. Quality and inequality in children’s literacy: the effects of families, schools and communities. In: Keating D, Hertzman C, eds. Developmental Health and the Wealth of Nations: Social, Biological, and Educational Dynamics. New York , NY : Guilford Press; 1999:72-93.
24. United Nations Development Program. Human Development Report 2005: International Cooperation at a Crossroads: Aid, Trade and Security in an Unequal World. New York , NY : United Nations Development Program; 2005.
25. Acheson D. Inequalities in Health: Report of an Independent Inquiry. London , England : Her Majesty’s Stationery Office; 1998.
26. Marmot M. Social determinants of health inequalities. Lancet. 2005; 365:1099-1104.
27. Putnam R. Bowling Alone: The Collapse and Revival of American Community. New York , NY : Simon & Schuster; 2000.
28. Murray CJL, Michaud CM, McKenna MT , Marks JS. US Patterns of Mortality by County and Race : 1965–94. Cambridge : Harvard Center for Population and Development Studies, 1998.
29. United Nations Development Group. Millennium Development Goals
30. Sachs JD, McArthur JW. The Millennium Project: a plan for meeting the Millennium Development Goals. Lancet 2005; 365:347–53.
31. Victora CG, Wagstaff A, Schellenberg JA, Gwatkin D, Claeson M, Habicht JP. Applying an equity lens to child health and mortality: more of the same is not enough. Lancet 2003; 362: 233–41.
32. Donkin A, Goldblatt P, Lynch K. Inequalities in life expectancy by social class 1972–1999. Health Statistics Quarterly 2002; 15: 5–15.
33. Mackenbach JP, Bos V, Andersen O, et al. Widening socioeconomic inequalities in mortality in six western European countries. Int J Epidemiol 2003; 32: 830–37.
34. Crimmins EM, Saito Y. Trends in healthy life expectancy in the United States, 1970–1990: Gender, Racial, and Educational Differences. Social Science Medicine 2001; 52: 1629–41.
35. Plavinski SL, Plavinskaya SI, Klimov AN. Social factors and increase in mortality in Russia in the 1990s: prospective cohort study. BMJ 2003; 326: 1240–42.
36. Wilkinson R, Marmot M. The Solid Facts . Copenhagen : WorldHealth Organization, 2003.
37. Wilkinson RG. The Impact of Inequality: How to Make Sick Societies Healthier . London : Routledge, 2005.
38. Farmer P. Pathologies of Power: Health, Human Rights, and the New War on the Poor . Berkeley : University of California Press, 2003.
39. Crombie IK, Irvine L, Elliott L, Wallace H. Closing the Health Inequalities Gap: an International Perspective . Dundee: NHS Health Scotland and University of Dundee , 2004.
40. Hogstedt H, Lundgren B, Moberg H, Pettersson B, Agren G. Swedish Public Health Policy and the National Institute of Public Health. Scan J Public Health 2004; 32 (suppl 64) : 1–64.
41. Sen A. Mortality as an Indicator of Success and Failure : Innocenti Inaugural Lecture 1995. Instituto degli Innocenti, Florence , Italy ; March 3, 1995.
42. Social Determinants of Health: The Solid Facts . 2nd edition, 2003. edited byRichard Wilkinson and Michael Marmot.
43. A physically active life through everyday transport with a special focus on children and older people and examples and approaches from Europe . Copenhagen , WHO Regional Office for Europe ,2002.
44. Transport, Environment and Health . Copenhagen , WHO Regional Office for Europe , 2000 2003
45. Davies A. Road Transport and Health . London , British Medical Association, 1997.
46. Health at the Crossroads: Transport Policy and Urban Health . Fletcher T, McMichael AJ, eds. New York , NY , Wiley, 1996.
47. Making the Connections: Transport and Social Exclusion . London , Social Exclusion Unit, Office of the Deputy Prime Minister, 2003
48. Marmot MG, Bosma H, Hemingway H, Brunner E, Stansfeld S. Contribution of job control and other risk factors to social variations in coronary heart disease. Lancet 1997; 350: 235-40.
49. Theorell T, Karasek R. The demand-control-support model and CVD. In: Schnall PL , Belkic K, Landsbergis P, Baker D, eds. The workplace and cardiovascular disease . Philadelphia : Hanley and Belfus, 2000: 78-83.
50. WHO. The World Health Report 2004: Changing History . Geneva : World Health Organization, 2004.
51. Christie, N. (1995b). The High Risk Child Pedestrian: Socio-economic and Environmental Factors in their Accidents . TRL Research Report PR117. Transport Research Laboratory: Crowthorne.
52. Christie, N., Towner, E., Cairns , S. and Ward, H. (2004). Children’s road traffic safety: an international survey of policy and practice . Road Safety Research Report No. 47. Department for Transport: London .
53. Grayling, T., Hallam, K., Graham, D., Anderson, R. and Glaister, S. (2002). Streets ahead: safe and liveable streets for children . IPPR: LondonBly, P., Dix, M. and Stephenson, C. (1999). Comparative study of European child pedestrian exposure and accidents . MVA Ltd: Surrey. 54. Lynam, D.A. and Harland, D.G. (1992). Why does the UK have a comparatively poor child pedestrian safety record? A paper presented to the FERSI Conference , Berlin , Germany .
55. Sonkin, B., Edwards, P., Roberts, I. , and Green, J. Walking, cycling and transport safety: an analysis of child road deaths. J R Soc Med. 2006 August; 99(8): 402-405
56. Thomson, J.A., Tolmie, A.K. and Mamoon, T.P. (2001). Road Accident Involvement of Children from Ethnic Minorities: A Literature Review . Road Safety Research Report No. 19. Department of the Environment, Transport and the Regions: London .
57. Harland, D.G., Bryan-Brown, K. and Christie, N. (1996 ). The pedestrian casualty problem in Scotland : Why so many? The Scottish Office Central Research Unit: Edinburgh .
58. Towner, E., Dowswell, T., Errington, G., Burkes, M. and Towner, J. (2003). Injuriesin children aged 0–14 years and Inequalities . Health Development Agency. London .
59. Stevenson, M., Iredell, H., Howat, P., Cross, D. and Hall, M. (1999). MeasuringCommunity/Environmental Interventions: The Child Pedestrian Injury Prevention Project. Injury Prevention 5(1).
60. Christie, N., Caims, S., Ward, H., and Towner, E. (2004)Children’s Traffic Safety: International Lessons for the UK : Road Safety Research Report No 50. Department of Transport: London .
61. Huttenmoser, D., Sauter, D. (2006) The contribution of good public spaces to social integration in urban neighbourgoods: Integration and Exclusion Swiss National Research Programme NRP 51.

Pedal People visit State College

The Pedal People :: Try fitting that in your SUV

The Pedal People, a cooperative human-powered delivery and hauling service for the Northampton, Massachusetts area appeared at a special CRBC event Friday, April 27 hosted by Freeze Thaw Cycles. The Pedal People ride year round, hauling garbage (which is independently contracted in Northampton), furniture, delivering groceries and packages of all kinds. All on bikes.


In addition, they offer classes in bike maintenance, and they serve as a catalyst to practical bicycling as a transportation alternative in their region. You can read about them at their great website :

“The Co-op uses bicycles and bicycle trailers to transport things, and is committed to using human power despite the culture of dependence on motorized vehicles. We hope that our use of relatively simple tools in sound business practice will debunk the prevailing belief that more technology is needed to solve problems.

We believe that social change is possible, and we share inspiration and education with people wanting to choose more sustainable lifestyles. We aim to make a living in a fair, noble way, exploiting no one.

We believe in the idea of low-income living as a counter to the work-consume-spend lifestyle common in America today. We also believe that by spending less time making a living, we can have more time to contribute to the community and live life at a human pace rather than a motorized pace.”

PHP Code Snippets Powered By : XYZScripts.com